Be detailed/explicit in your answers. PROVIDE EXAMPLES in answers. Use this sheet as the coversheet to your answers.
Problem 1 (5 points): Describe the difference between discrete and continuous data. Include examples of each and a graph of each type of data.
Problem 2 (5 points): What is the difference between a statistic and a parameter? Give an example of each.
Problem 3 (10 points): Explain what bias is and provide/explain a minimum of five (5) different ways data can be biased.
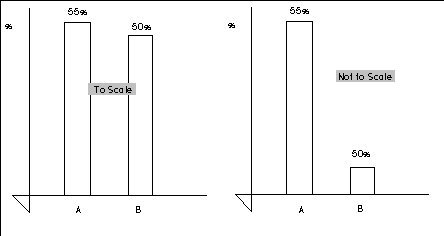
Example: Graphs (bar and/or pie) can be used to exaggerate or understate the nature of data as shown in the graphs to the right.
Problem 4 (5 points): Explain correlation and causality. Provide a supporting example with a graph to amplify your response.
Problem 5 (10 points): Explain WHY the correct design of a statistical experiment is so important and a negative results of a poorly designed experiment. Include an example of a poorly designed experiment.
Problem 6 (5 points): Explain "confounding" of variables in an experiment. Provide an example of how this might occur in an experiment.
Problem 7 (10 points): Differentiate between a sampling error and a non-sampling error. Be specific in your explanation and provide examples of each type of error.
Bonus (5 points) Who sang the lyrics "This is real, so take a chance. And don't ever look back, don't ever look back."
Example of biased graph